In recent months, more people have quietly returned to a familiar tool in a fast-changing digital world: Microsoft Excel. While conversations online often focus on advanced coding languages and artificial intelligence, many professionals are rediscovering that real decisions in offices, startups, NGOs, and even small businesses still begin with rows, columns, and clear thinking.
That is why programs like Data Analysis and Visualization with Microsoft Excel continue to attract serious attention in 2025. Not because Excel is trendy, but because it remains practical, trusted, and deeply useful.
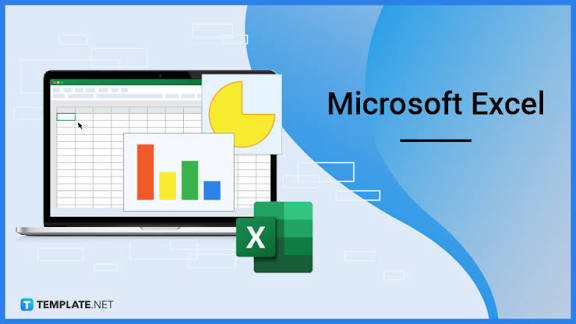
Excel Is Still Where Real Work Happens
From my experience working with small teams and content operations, most important data does not start in complex dashboards. It starts messy. Sales records, attendance sheets, customer feedback, survey results, expenses. Excel is often the first place people clean that data, understand patterns, and ask better questions.
What makes Excel powerful is not just formulas or charts. It is the way it forces clarity. When numbers are laid out in front of you, mistakes show themselves. Trends become visible. Decisions become easier to defend.
Even in environments where advanced tools exist, Excel often acts as the bridge between raw information and final insight.
Why Data Visualization Matters More Than Ever
In 2025, attention is limited. People do not want long explanations filled with technical terms. They want to see the point quickly.
Read Also:How to Generate Your JAMB Profile Code for 2026 UTME Registration
Good data visualization is not about decoration. It is about honesty and focus. A simple chart can explain what ten paragraphs cannot. Excel’s visualization tools, when used well, help people communicate findings clearly to managers, clients, and stakeholders who may not be technical at all.
I have seen meetings change direction simply be socause someone presented a clean chart instead of a confusing table.
Learning Excel Today Is a Strategic Choice
Many people underestimate Excel because it feels familiar. That is a mistake. Modern Excel includes advanced functions for analysis, automation, and visual storytelling. Learning these skills properly gives you an advantage that applies almost anywhere: business, education, research, administration, and entrepreneurship.
What stands out in structured Excel learning programs is not just the software training, but the mindset. You learn how to think about data, how to ask the right questions, and how to explain answers clearly.
Those skills do not expire.
What People Usually Want to Know
Is Excel still relevant for data analysis in 2025?
Yes. Excel remains one of the most widely used data tools in the world. It is accessible, trusted, and accepted across industries.
Can Excel really help with visualization?
Absolutely. With the right approach, Excel charts can clearly show trends, comparisons, and insights without overwhelming the viewer.
Is Excel useful without coding knowledge?
That is one of its biggest strengths. You can perform meaningful analysis without writing a single line of code.
An Expert Perspective
Data tools come and go, but fundamentals remain. In my observation, professionals who understand Excel deeply tend to adapt faster to new platforms. They already know how data behaves. New tools simply become extensions of that understanding, not replacements for it.
Excel teaches discipline. That discipline transfers everywhere.
One Simple Action You Can Take
Open an old spreadsheet you once abandoned. Clean it. Create one clear chart that tells a story. That small exercise will remind you why Excel continues to matter — and why mastering it is still a smart investment in 2025.
At AllMediaPlus.com, we believe progress often comes from mastering the tools people overlook. Excel is one of them.
Why Learning Data Analysis with Microsoft Excel Still Matters in 2025
In recent months, more people have quietly returned to a familiar tool in a fast-changing digital world: Microsoft Excel. While conversations online often focus on advanced coding languages and artificial intelligence, many professionals are rediscovering that real decisions in offices, startups, NGOs, and even small businesses still begin with rows, columns, and clear thinking.
That is why programs like Data Analysis and Visualization with Microsoft Excel continue to attract serious attention in 2025. Not because Excel is trendy, but because it remains practical, trusted, and deeply useful.
Excel Is Still Where Real Work Happens
From my experience working with small teams and content operations, most important data does not start in complex dashboards. It starts messy. Sales records, attendance sheets, customer feedback, survey results, expenses. Excel is often the first place people clean that data, understand patterns, and ask better questions.
What makes Excel powerful is not just formulas or charts. It is the way it forces clarity. When numbers are laid out in front of you, mistakes show themselves. Trends become visible. Decisions become easier to defend.
Even in environments where advanced tools exist, Excel often acts as the bridge between raw information and final insight.
Why Data Visualization Matters More Than Ever
In 2025, attention is limited. People do not want long explanations filled with technical terms. They want to see the point quickly.
Good data visualization is not about decoration. It is about honesty and focus. A simple chart can explain what ten paragraphs cannot. Excel’s visualization tools, when used well, help people communicate findings clearly to managers, clients, and stakeholders who may not be technical at all.
I have seen meetings change direction simply because someone presented a clean chart instead of a confusing table.
Learning Excel Today Is a Strategic Choice
Many people underestimate Excel because it feels familiar. That is a mistake. Modern Excel includes advanced functions for analysis, automation, and visual storytelling. Learning these skills properly gives you an advantage that applies almost anywhere: business, education, research, administration, and entrepreneurship.
What stands out in structured Excel learning programs is not just the software training, but the mindset. You learn how to think about data, how to ask the right questions, and how to explain answers clearly.
Those skills do not expire.
What People Usually Want to Know
Is Excel still relevant for data analysis in 2025?
Yes. Excel remains one of the most widely used data tools in the world. It is accessible, trusted, and accepted across industries.
Can Excel really help with visualization?
Absolutely. With the right approach, Excel charts can clearly show trends, comparisons, and insights without overwhelming the viewer.
Is Excel useful without coding knowledge?
That is one of its biggest strengths. You can perform meaningful analysis without writing a single line of code.
An Expert Perspective
Data tools come and go, but fundamentals remain. In my observation, professionals who understand Excel deeply tend to adapt faster to new platforms. They already know how data behaves. New tools simply become extensions of that understanding, not replacements for it.
Excel teaches discipline. That discipline transfers everywhere.
Stay Connected with AllMediaplus.com Enjoyed this post? Join our community to receive timely updates, trusted guides, and important news. Join our WhatsApp Group:
https://chat.whatsapp.com/LYOF1rlyCODF2CJsRwxqHc
Follow our WhatsApp Channel:
https://whatsapp.com/channel/0029Vb74OUm9Gv7VtNOVFW21
Like our Facebook Page:
https://facebook.com/allmedia24news
One Simple Action You Can Take
Open an old spreadsheet you once abandoned. Clean it. Create one clear chart that tells a story. That small exercise will remind you why Excel continues to matter — and why mastering it is still a smart investment in 2025.
At AllMediaPlus.com, we believe progress often comes from mastering the tools people overlook. Excel is one of them.